What is correlation? How level of measurement help us in selecting correct type of correlation? Write comprehensive note on range of correlation coefficient and what does it explain? Can we predict future correlation by current relationship? If yes, then how?
If you want to view other related topics. Click Here.
The correlation is one of the most common and most useful statistics. A correlation is a single number that describes the degree of relationship between two variables. Let's work through an example to show you how this statistic is computed.
Correlation Example
Let's assume that we want to look at the relationship between two variables, height (in inches) and self esteem. Perhaps we have a hypothesis that how tall you are affects your self esteem (incidentally, I don't think we have to worry about the direction of causality here -- it's not likely that self esteem causes your height!). Let's say we collect some information on twenty individuals (all male -- we know that the average height differs for males and females so, to keep this example simple we'll just use males). Height is measured in inches. Self esteem is measured based on the average of 10 1-to-5 rating items (where higher scores mean higher self esteem). Here's the data for the 20 cases (don't take this too seriously -- I made this data up to illustrate what a correlation is):
Person Height Self Esteem
1 68 4.1
2 71 4.6
3 62 3.8
4 75 4.4
5 58 3.2
6 60 3.1
7 67 3.8
8 68 4.1
9 71 4.3
10 69 3.7
11 68 3.5
12 67 3.2
13 63 3.7
14 62 3.3
15 60 3.4
16 63 4.0
17 65 4.1
18 67 3.8
19 63 3.4
20 61 3.6
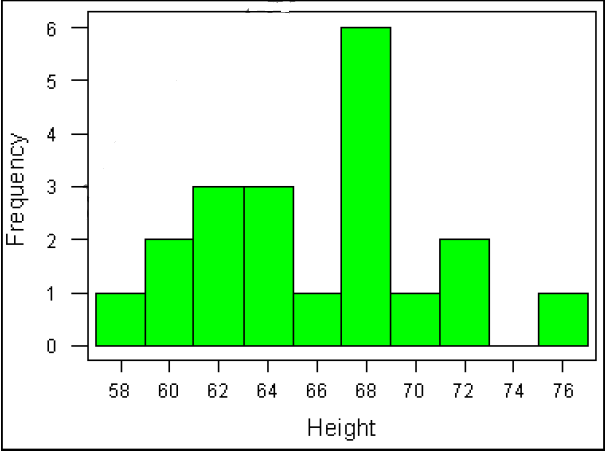
Now, let's take a quick look at the histogram for each variable:


Finally, we'll look at the simple bivariate (i.e., two-variable) plot:
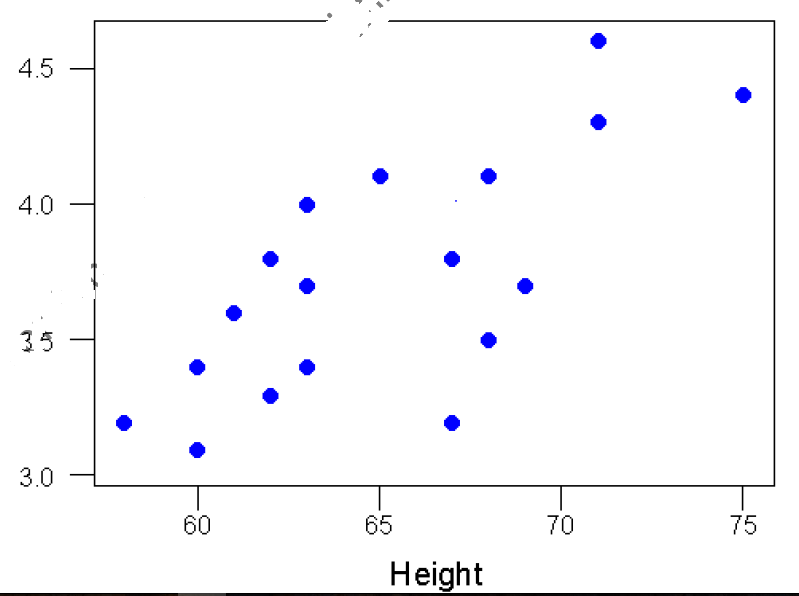
You should immediately see in the bivariate plot that the relationship between the variables is a positive one (if you can't see that, review the section on types of relationships) because if you were to fit a single straight line through the dots it would have a positive slope or move up from left to right. Since the correlation is nothing more than a quantitative estimate of the relationship, we would expect a positive correlation.
What does a "positive relationship" mean in this context? It means that, in general, higher scores on one variable tend to be paired with higher scores on the other and that lower scores on one variable tend to be paired with lower scores on the other. You should confirm visually that this is generally true in the plot above.
Calculating the Correlation
Now we're ready to compute the correlation value. The formula for the correlation is:
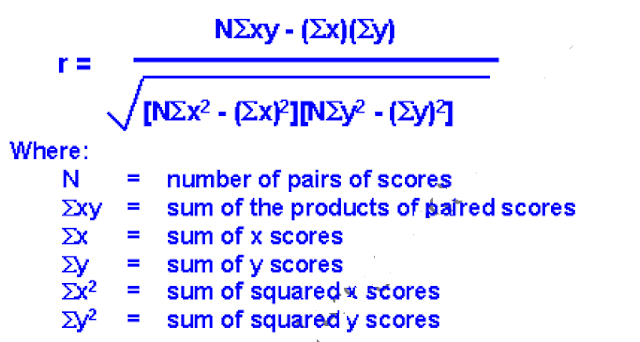

We use the symbol r to stand for the correlation. Through the magic of mathematics it turns out that r will always be between -1.0 and +1.0. if the correlation is negative, we have a negative relationship; if it's positive, the relationship is positive. You don't need to know how we came up with this formula unless you want to be a statistician. But you probably will need to know how the formula relates to real data -- how you can use the formula to compute the correlation. Let's look at the data we need for the formula.
*********************************************************************************
Post a Comment